
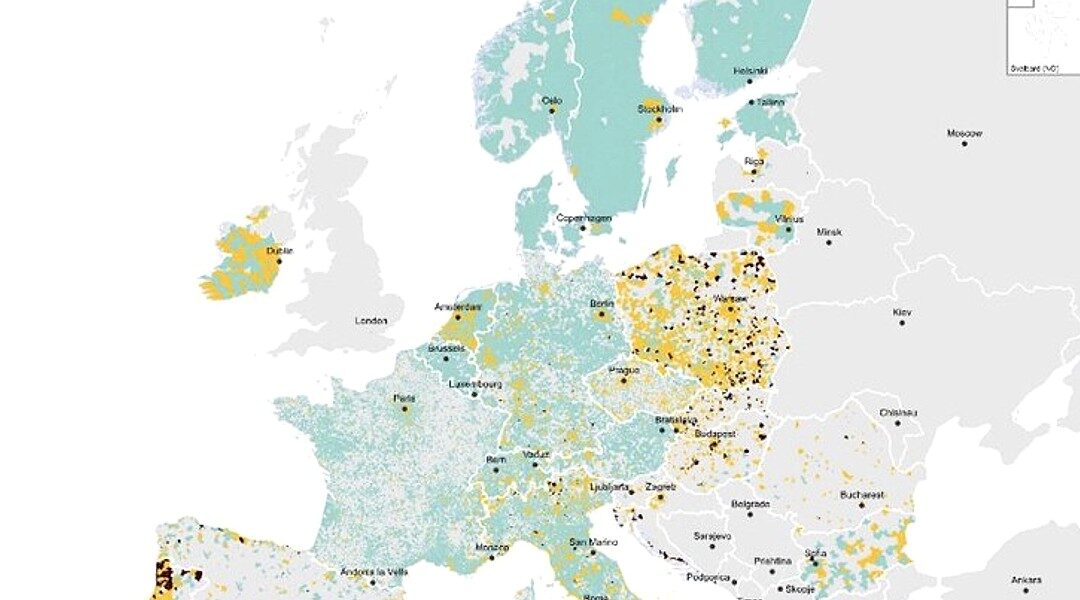
Explore how European salaries are impacted by housing costs through detailed maps. Understand data insights and regional differences in rental affordability.
In recent years, housing affordability has become a critical issue across Europe, with rental prices skyrocketing and salaries struggling to keep pace. This pressing concern is vividly illustrated by a new set of maps developed by the House for All project, a European initiative led by the Technical University of Vienna. These maps offer a detailed look at how much of an individual’s salary is consumed by rental costs across different regions, effectively turning a ubiquitous economic issue into a visual narrative.
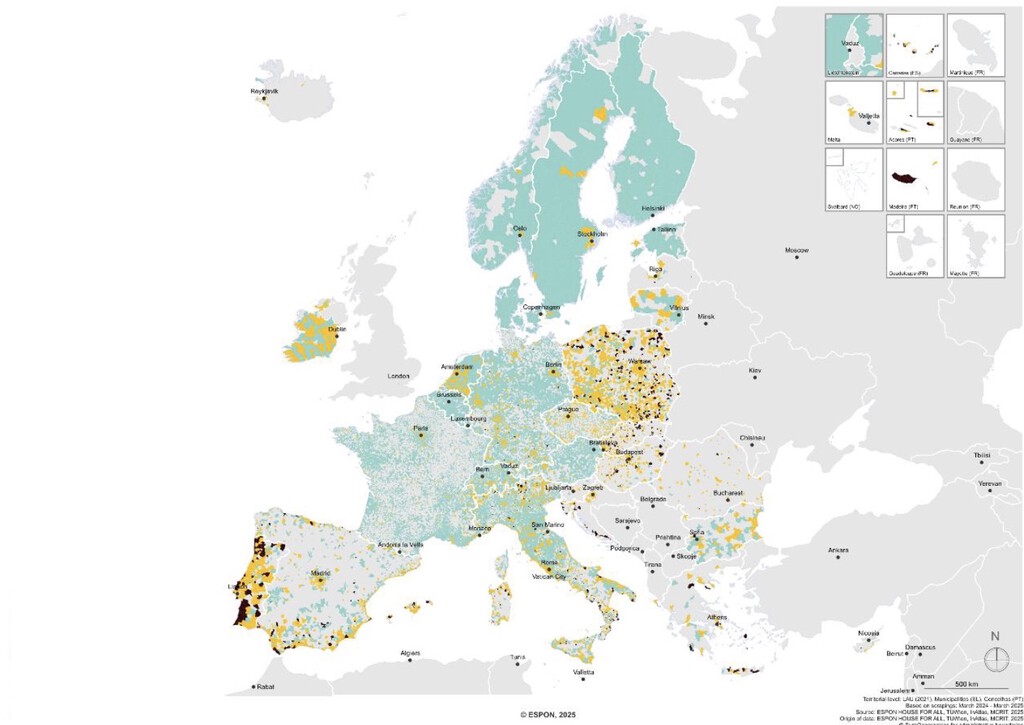
To create these maps, data from 22 million rental listings were collected and analyzed over a year-long period from March 2024 to March 2025. This data, derived from real estate portals across Europe, was used to calculate average rental prices per municipality. The results were then compared with average local incomes using Eurostat data, providing a comprehensive overview of housing affordability throughout the continent.
Visualizing Rental Impact by Size
The maps categorize rental costs for three property sizes: 25, 45, and 75 square meters. Each map uses a color-coded system where turquoise indicates rental costs less than one-third of the average local salary, yellow represents costs between one-third and two-thirds, and black denotes areas where rent exceeds two-thirds of local income. This visual approach reveals stark contrasts in rental affordability across Europe.
Spaces Under 25 Square Meters
For properties measuring 25 square meters or less, much of Europe, including Scandinavia, the Baltic states, and parts of France, Germany, and Italy, appear in turquoise. These regions boast rental affordability, suggesting that living solo is financially viable. However, major urban areas in Poland, Slovakia, Portugal, and southern Spain highlight emerging yellow zones, indicating a higher financial burden.
Despite these insights, the map also brings to light the scarcity of such small dwellings in many areas unless specifically noted like in Sweden or Finland, where they are more common. In Spain, legal restrictions often conflict with the existence of these smaller units, making them less available than the data might imply.
The Mid-Size Challenge: 45 Square Meters
Turning to 45 square meters, the map reveals a landscape where affordability further diminishes. Especially in southern Portugal, southern Spain, Ireland’s urban areas, and parts of Germany and Austria, rent occupies a significant slice of income. Yet, central and northern Europe largely remain in turquoise, highlighting lower rent-to-income ratios in these regions.
This mid-size category, representing the most typical single-person accommodation in Europe, underscores the economic tension many inhabitants face. In eastern Europe, pervasive yellow zones, coupled with scattered black patches, highlight low local incomes as a contributing factor to higher financial stress related to housing.
Spacious Yet Costly: 75 Square Meters
The depiction of 75-square-meter properties paints a challenging picture. In virtually all major European cities and tourist-heavy coastal regions, such as the French Riviera and southern Spain, rent significantly impacts affordability. This makes independent living on a single salary difficult, if not impossible, in these areas.
While sharing accommodations could mitigate costs, the demand for individual living spaces remains apparent, driven partly by the need for home offices in the age of remote work. Thus, the desirability of these larger spaces often clashes with their prohibitive costs.
Data-Driven Insights into European Housing
The maps developed by the House for All project offer a powerful lens into the ongoing housing crisis in Europe. They highlight the pressing need for policy interventions tailored to regional economic landscapes. By visualizing data in an accessible format, these maps not only present the stark realities of rental affordability but also emphasize the nuanced interplay between local income levels and housing costs.
Observation recorded. Monitoring continues.